

What Makes It Better & What Makes It Worse
The decline in stocks continued last week as the S&P 500’s pullback from the highs eclipsed 10% before bouncing on Friday, as policy uncertainty was compounded last week by warnings about earnings from companies from various industries. At this point, sentiment has turned decidedly negative, and the S&P 500 is at the level that we and others identified as the “pain threshold” that triggered the “Trump Put” in 2018.
So far, it doesn’t appear that's going to happen and because of that, I wanted to identify events that would either 1) Make this selloff worse or 2) Lead to a sustainable rebound in stocks (right now, most rallies, including Friday’s, should be viewed as little more than a technical bounce).
What Makes This Better
A clearly defined policy goal (markets don’t necessarily need the removal of tariffs to stabilize): As we and others have explained, the No. 1 reason stocks are dropping is because of the chaotic and unorganized communications from the administration that have led investors to believe there is no clear goal with regard to tariffs. Essentially, investors are wondering, “What is the administration trying to accomplish with these tariff threats?” Is it to reduce fentanyl coming into the country? Is it to increase Federal revenue through tariffs? Is it to threaten reciprocal tariffs to cause other countries to reduce their tariffs and lead to more free trade?”
The most beneficial thing the administration could do for markets is to identify an end policy goal. That would help reduce uncertainty and be a major step towards ending this selloff. Other Anecdotal Positives: 1) A dovish Fed this Wednesday. The Fed reinforcing the “Fed Put” exists will be an incremental positive as it’ll push back on the chances of a dramatic economic slowdown. 2) Solid economic data. Better-than-expected retail sales and Philly/Empire Fed (along with low jobless claims) will push back on the idea that this uncertainty is causing an actual slowdown. 3) More optimistic corporate commentary.
Numerous companies from the retail, tech, and transportation industries reduced their outlook last week, compounding fears this uncertainty was leading to consumers and businesses pulling in spending. More optimistic reports will push back on that fear. However, while these are anecdotal positives, they will not end this selloff because investors are afraid of the future implications of policy chaos. So, these positives will provide some support, but they won’t end this decline.
What Makes This Worse
1: More of the same. For the pullback to continue and to get worse, the administration just has to continue delivering a chaotic and apparently unorganized communication strategy that has caused this 10% decline. More random tariff threats, moving of trade goalposts and threats against other allies will just increase the likelihood the chaos causes a legitimate economic slowdown. Candidate 2: Soft economic data. So far, economic data has pushed back against slowdown concerns, but if that changes this week and Retail Sales, Philly/Empire Fed or jobless claims are soft, concerns about a recession will spike. Essentially, this will make investors think the economic damage from the policy uncertainty has already been done. Candidate 3: More corporate earnings warnings. As mentioned, companies such as Delta, Kohl’s and CSX have all warned of reduced consumer spending and lower earnings. If that continues and increases across industries, that will likely confirm that $270/share S&P 500 earnings expectations are too high and that this market is even more expensive than we think, leaving it open to a further decline.
Bottom Line Sentiment is incredibly negative right now and reasonably so, but there are two important aspects of this pullback to consider. First, the market needs clarity. The actual trade and tariff policy isn’t the problem. Markets can understand that and price it in appropriately. The problem is that the market doesn’t think the administration has a clear goal or objective. The sooner the “plan” can be communicated to markets, the sooner this pullback ends. Second, the S&P 500 is down close to 10% YTD but it’s not a wholesale market destruction. Parts of the U.S. market are holding in well, including low-volatility ETFs (USMV/SPLV) and defensive sectors (XLU/XLV/XLP/ XLRE). Additionally, international is also outperforming (European ETFs are up solidly YTD). Point being, there remain places to “hide” and the majority of this pullback is still tech-driven (i.e., this is not a widescale washout in the market).
This begs the question should we move to more defensive positions? The answer lies in a description of secular markets. The chart below is a secular bull market.
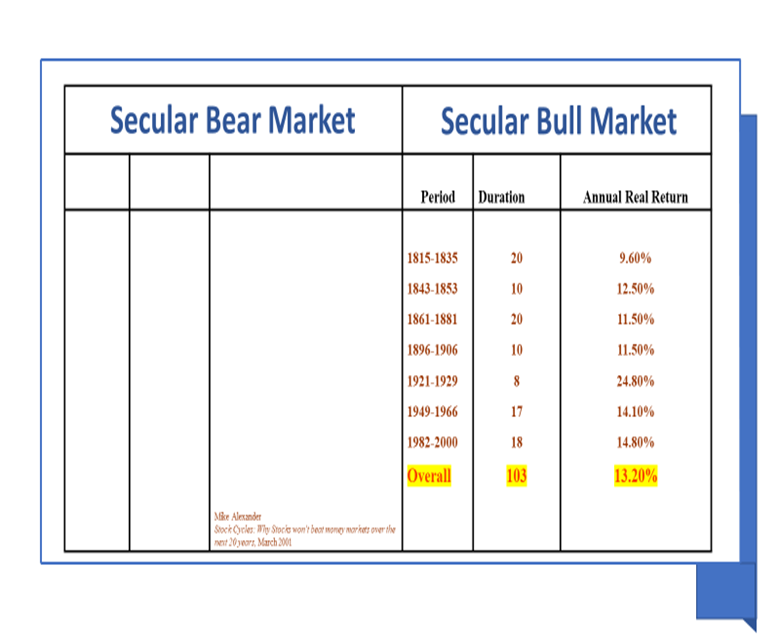
As you can see from the chart, secular bull markets last between 8 years and 20 years and have an average return of 13.2%. The last secular bull market was 1982 to 2000 with an average return of 14.8% with downturns that lasted a very short term and recovered quickly. In a secular bull market, it does not pay to try to time the market. It is better to ride out the downturns as trying to time the market will produce worse results.
Secular bear markets are quite the opposite:
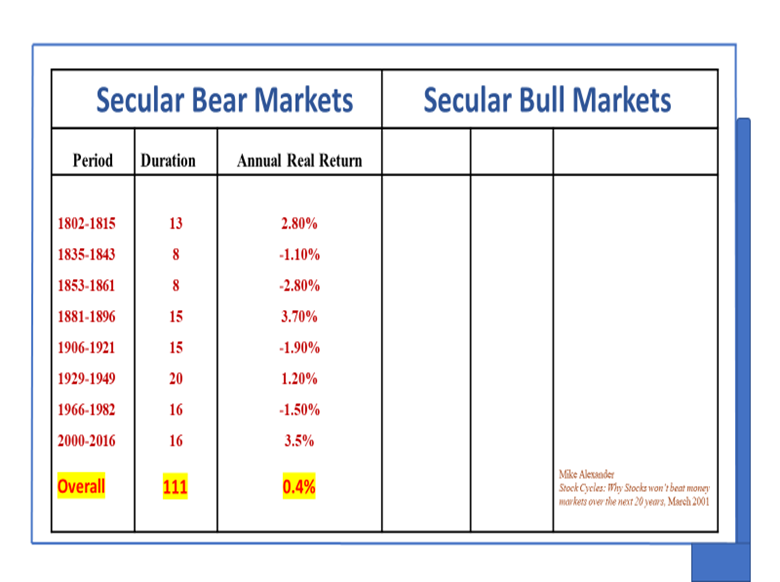
A secular bear market lasts between 8 years and 20 years, like a secular bull market. The difference is the average return: 0.4%. In this case the downturns last longer and the recoveries take between 5 years and 10 years.
Let’s look at an example of both:
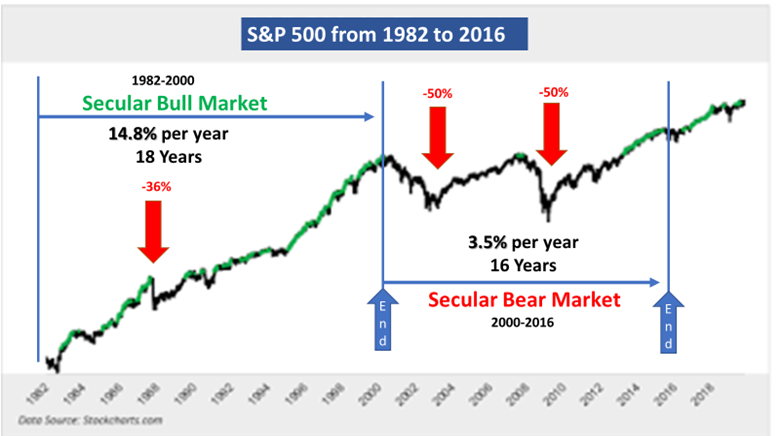
The left chart pictures the last secular bull market, 1982 – 2000. As you can see, the 1987 downturn lasted three months and recovered in 18 months. You can also see that the chart looks like a straight line up. If you look at charts of 2017 to the present day, a secular bull market, the chart also looks like an upturning straight line.
The right side chart is the last secular bear market. As you can see the downturns are more severe and last longer. You should also notice that the recoveries are much longer, between 5 years and 10 years depending on the markets.
What I am trying to demonstrate is that you should not panic about this downturn because it is within a secular bull market. It will be less severe and short. The recovery will be fairly short if it models past secular bull markets. I must note that past markets are no indication of current markets, but can be helpful in understanding the current market.
Again turn to my 5 part series on future markets that I am writing every Thursday. I have covered the first two keys and this Thursday will cover the third key. In this series, I am covering the 5 keys to the future of this market. In it, you will know why we should expect a positive outcome of this downturn.